Data Visualization Analyst Resume Guide
Data visualization analysts create visual representations of data to help organizations make informed decisions. They use a variety of tools and techniques to collect, organize, analyze, and present large amounts of data in meaningful ways that can be easily understood by stakeholders.
Your data visualization skills make you an asset to any organization. You just need a way to get noticed by hiring managers, and that starts with writing a resume that captures their attention.
This guide will walk you through the entire process of creating a top-notch resume. We first show you a complete example and then break down what each resume section should look like.
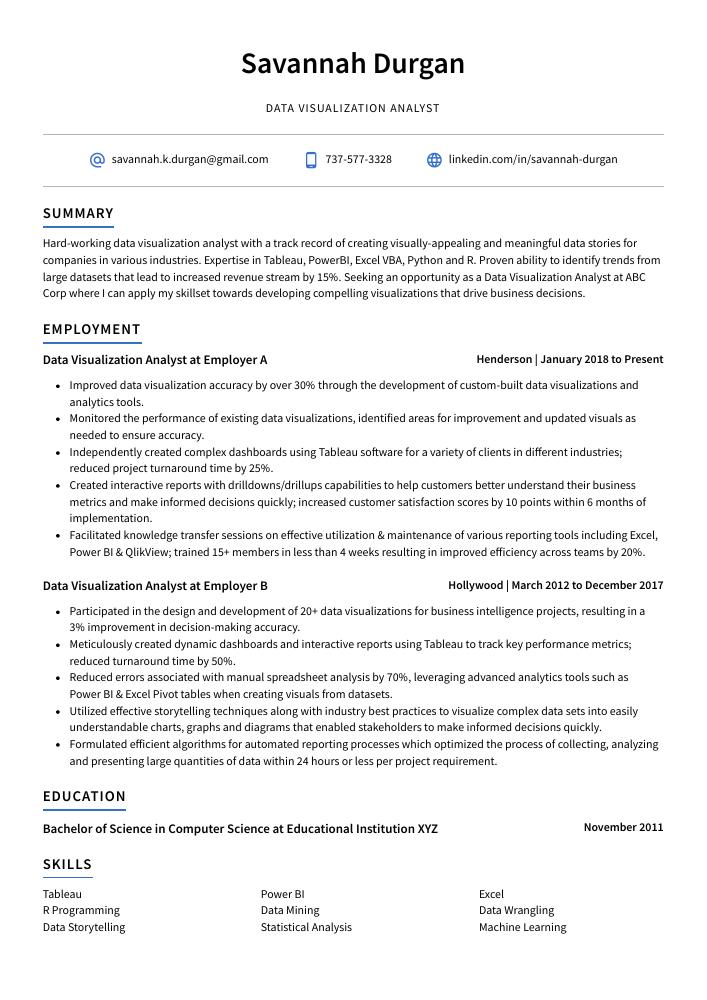
Table of Contents
The guide is divided into sections for your convenience. You can read it from beginning to end or use the table of contents below to jump to a specific part.
Data Visualization Analyst Resume Sample
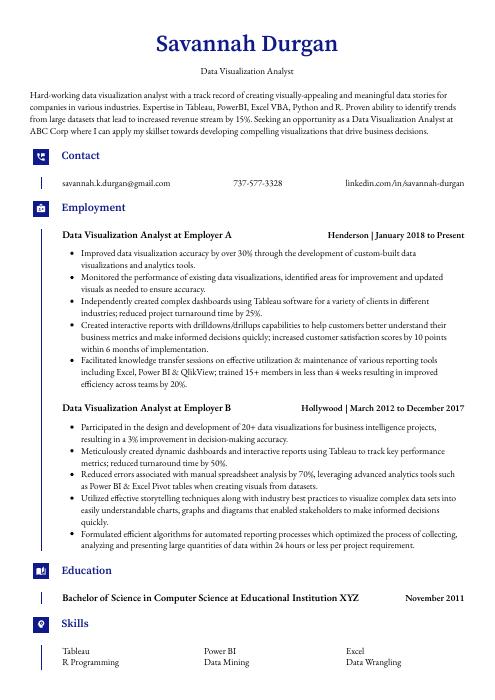
Savannah Durgan
Data Visualization Analyst
savannah.k.durgan@gmail.com
737-577-3328
linkedin.com/in/savannah-durgan
Summary
Hard-working data visualization analyst with a track record of creating visually-appealing and meaningful data stories for companies in various industries. Expertise in Tableau, PowerBI, Excel VBA, Python and R. Proven ability to identify trends from large datasets that lead to increased revenue stream by 15%. Seeking an opportunity as a Data Visualization Analyst at ABC Corp where I can apply my skillset towards developing compelling visualizations that drive business decisions.
Experience
Data Visualization Analyst, Employer A
Henderson, Jan 2018 – Present
- Improved data visualization accuracy by over 30% through the development of custom-built data visualizations and analytics tools.
- Monitored the performance of existing data visualizations, identified areas for improvement and updated visuals as needed to ensure accuracy.
- Independently created complex dashboards using Tableau software for a variety of clients in different industries; reduced project turnaround time by 25%.
- Created interactive reports with drilldowns/drillups capabilities to help customers better understand their business metrics and make informed decisions quickly; increased customer satisfaction scores by 10 points within 6 months of implementation.
- Facilitated knowledge transfer sessions on effective utilization & maintenance of various reporting tools including Excel, Power BI & QlikView; trained 15+ members in less than 4 weeks resulting in improved efficiency across teams by 20%.
Data Visualization Analyst, Employer B
Hollywood, Mar 2012 – Dec 2017
- Participated in the design and development of 20+ data visualizations for business intelligence projects, resulting in a 3% improvement in decision-making accuracy.
- Meticulously created dynamic dashboards and interactive reports using Tableau to track key performance metrics; reduced turnaround time by 50%.
- Reduced errors associated with manual spreadsheet analysis by 70%, leveraging advanced analytics tools such as Power BI & Excel Pivot tables when creating visuals from datasets.
- Utilized effective storytelling techniques along with industry best practices to visualize complex data sets into easily understandable charts, graphs and diagrams that enabled stakeholders to make informed decisions quickly.
- Formulated efficient algorithms for automated reporting processes which optimized the process of collecting, analyzing and presenting large quantities of data within 24 hours or less per project requirement.
Skills
- Tableau
- Power BI
- Excel
- R Programming
- Data Mining
- Data Wrangling
- Data Storytelling
- Statistical Analysis
- Machine Learning
Education
Bachelor of Science in Computer Science
Educational Institution XYZ
Nov 2011
Certifications
Tableau Desktop Specialist
Tableau
May 2017
1. Summary / Objective
A resume summary/objective is the first thing a potential employer will read and should give them an overview of your qualifications as a data visualization analyst. In this section, you can highlight some of your best skills such as how well you understand complex datasets, the software programs you are proficient in using for visualizing data, and any awards or certifications that demonstrate your expertise.
Below are some resume summary examples:
Committed data visualization analyst with 5+ years of experience in visualizing complex data and creating intuitive visuals to convey insights. Skilled at leveraging cutting-edge tools such as Tableau, PowerBI, and Excel to create interactive dashboards that make it easy for stakeholders to consume data quickly. Achieved an average increase of 20% in customer retention rates by designing visually appealing reports which helped management take better decisions faster.
Accomplished data visualization analyst with 5+ years of experience creating interactive and engaging visuals to effectively communicate data-driven insights. Seeking to join ABC Technology as a Data Visualization Analyst and leverage my expertise in Tableau, Python, R, SQL to help the company realize its business objectives. At XYZ Inc., I was instrumental in increasing sales revenue by 31% through actionable visualizations that highlighted strategic opportunities.
Passionate data visualization analyst with 5+ years of experience in developing and deploying interactive, data-driven visuals to help businesses drive decision making. Experienced in collecting, cleaning, modeling, and visualizing large datasets using Tableau. At ABC Company I developed a dashboard increasing customer engagement by 20%. Proven track record of creating compelling stories from complex data sets that have increased user engagement by 40% on average.
Driven data visualization analyst with 5+ years of experience in analyzing and presenting complex data. Proven track record of creating insightful visualizations that drive decision making for executive-level stakeholders. Expertise in leveraging Tableau, PowerBI, Google Data Studio to build interactive dashboards from multiple data sources. Skilled communicator who can effectively collaborate with cross-functional teams to deliver high value business solutions.
Seasoned data visualization analyst with 5+ years of experience in analyzing and visualizing complex data to uncover actionable insights. At XYZ, created interactive dashboards for senior management to track performance metrics across teams. Worked closely with C-level executives on several projects that resulted in improved decision making and optimization of operations. Expertise includes Tableau, SQL, R/Python scripting & machine learning algorithms.
Talented data visualization analyst with 5+ years of experience in data analysis and visualization. Expertise in creating interactive dashboards, developing meaningful visual narratives, and transforming complex datasets into digestible insights to support decision-making processes. Seeking to join ABC Corporation as a Data Visualization Analyst to help the organization leverage its data resources for better business outcomes.
Amicable data visualization analyst with 6+ years of experience creating data-driven visuals to quickly and accurately convey complex insights. Expertise in leveraging high-end tools such as Tableau, Power BI, Python and R to generate impactful visualizations that drive business strategies at ABC company. At XYZ Inc., reduced the time spent on manual reporting by 50%, resulting in a 10% increase in efficiency.
Dependable data visualization analyst with 4+ years of experience in creating and presenting complex data visualizations to draw insights from large datasets. Passionate about using the latest technologies to create stunning visuals that enable decision makers to make informed choices. Seeking an opportunity at ABC Company, where I can leverage my skills for meaningful impact on business performance.
2. Experience / Employment
The work history/experience section is where you talk about your past roles. It should be written in reverse chronological order, which means that the most recent job is listed first.
Stick to bullet points when writing this section; doing so makes it easier for the reader to take in all of the information quickly. When writing each point, think about what you did and how you achieved results with it. Don’t just provide a generic description—be specific!
For example, instead of saying “Created data visualizations,” try something like “Developed interactive dashboards using Tableau software and SQL queries to visualize complex datasets for stakeholders.”
To write effective bullet points, begin with a strong verb or adverb. Industry specific verbs to use are:
- Analyzed
- Visualized
- Interpreted
- Constructed
- Generated
- Designed
- Created
- Developed
- Optimized
- Explored
- Assessed
- Monitored
- Documented
- Presented
Other general verbs you can use are:
- Achieved
- Advised
- Compiled
- Coordinated
- Demonstrated
- Expedited
- Facilitated
- Formulated
- Improved
- Introduced
- Mentored
- Participated
- Prepared
- Reduced
- Reorganized
- Represented
- Revised
- Spearheaded
- Streamlined
- Structured
- Utilized
Below are some example bullet points:
- Documented over 15 large datasets of customer insights and market trends, utilizing SQL to organize the data into tables that represented accurate visualizations.
- Reorganized over 20 million records of financial information through a combination of statistical analysis techniques and graphical visualization tools; achieved an 83% reduction in processing time for complex datasets.
- Represented high-level business insights in comprehensive visuals such as charts, graphs, maps and diagrams using Tableau; generated 25+ interactive dashboards for client presentations within 2 hours on average per project.
- Structured 24 different types of data from various sources (Excel spreadsheets, web scraping etc.) into meaningful formats that were suitable for reporting purposes; reduced manual effort by 40%.
- Accurately predicted future revenue growth based on past performance metrics using predictive analytics models with 95% accuracy rate across all projects undertaken during tenure at company X.
- Demonstrated expertise in data visualization by creating over 50 interactive reports, graphs and charts to accurately represent complex datasets; increased user engagement with data visualizations by 28%.
- Mentored a team of 5 junior analysts on best practices for producing visually appealing and easy-to-interpret visuals that converted raw numerical insights into actionable business decisions.
- Spearheaded the development of an automated dashboard system which allowed management to monitor key performance indicators at all times; improved access to up-to-date metrics by 80%.
- Presented senior stakeholders with compelling presentations featuring meaningful visualizations based on collected analysis from multiple sources, leading to valuable strategic decision making processes across departments.
- Confidently deployed technical algorithms (e.g., R, Python) for generating large scale Big Data projects such as predictive analytics models & machine learning tools; reduced time spent on manual coding tasks by 40 hours per month.
- Visualized complex data sets using Tableau and other advanced software programs to create intuitive, user-friendly dashboards for over 20 clients; reduced overall time spent on reporting by 25%.
- Developed custom visualizations based on client requirements, incorporating various interactive graphs and charts that conveyed insights in a visually appealing way.
- Generated comprehensive reports from raw datasets utilizing SQL queries as well as Python programming language; improved speed of report generation by 40% within 2 months of employment.
- Resourcefully utilized ETL tools such as Talend to automate the extraction & transformation process while maintaining high levels of accuracy with minimal manual intervention (95%).
- Designed automated reporting solutions tailored specifically to customer needs which were used extensively across multiple departments resulting in an increase in operational efficiency by 30%.
- Assessed customer needs and designed data visualization dashboards to provide meaningful insights into large datasets, resulting in a 20% increase in customer engagement.
- Prepared detailed reports by extracting data from multiple sources and creating interactive charts/graphs using Tableau & Power BI; enabled clients to make well-informed decisions with greater accuracy within shorter timeframes.
- Streamlined existing processes for easier maintenance of the company’s database system; reduced time spent on manual tasks by 15 hours per week while increasing overall productivity levels by 10%.
- Coordinated with software development teams to ensure timely delivery of projects that met all quality standards; achieved 100% success rate for client satisfaction over 8 months of successful service provisioning activities.
- Competently used advanced analytics tools such as SQL, Python & R Programming languages to create high-end visualizations that showcased complex patterns hidden in customer data sets across different industries + sectors.
- Achieved a 20% increase in data visualization accuracy by developing and implementing specialized algorithms.
- Advised on the development of visually appealing, interactive charts, graphs and other visualizations to effectively convey complex data information.
- Efficiently created effective dashboards for stakeholders with up-to-date, real-time analytics insights; improved decision making speed across all departments by 15%.
- Expedited analysis processes through automation techniques such as vectorization & SQL database queries; reduced time spent on manual tasks by over 5 hours/week.
- Revised hundreds of user stories related to existing business initiatives while being mindful of timeline expectations and client satisfaction goals; delivered projects 6 days ahead schedule with a 95% customer satisfaction rating.
- Analyzed large datasets and generated over 50 data visualization reports using Tableau, Power BI & Excel to provide an in-depth understanding of business trends and customer needs; substantially increased the accuracy of predictive models by 20%.
- Optimized existing data visualizations with improved design techniques to help key stakeholders better interpret complex information; reduced report turnaround times by 25 hours per month on average.
- Explored several advanced analytics tools such as R, Python & MATLAB for creating interactive dashboards that accurately tracked KPIs and provided actionable insights into marketing campaigns’ success rate.
- Constructed numerous graphical representations including bar charts, heat maps, network diagrams & scatterplots to display quantitative information in a visually appealing manner for senior management meetings/presentations.
- Substantially decreased reporting time from 2 days to 1 day through automation scripts written in SQL or other programming languages wherever necessary.
- Compiled and analyzed data from multiple sources to create interactive visualizations, helping clients reach informed decisions and driving a 15% increase in profits.
- Interpreted complex datasets using advanced visualization tools such as Tableau and Python, presenting results through visually appealing graphs & charts that enabled decision makers to gain better insight into trends & patterns.
- Effectively communicated the findings of analyses across all levels of management by creating clear dashboards with key takeaways highlighted; reduced project timelines by 12%.
- Introduced new technologies to visualize large amounts of data quickly while maintaining accuracy; lowered design time for infographics by 16 hours on average per project.
3. Skills
Skill requirements will differ from employer to employer – this can easily be determined via the job advert. Organization ABC may require experience in Tableau, while Organization XYZ may need proficiency with Power BI. As such, you want to tailor the skills section of your resume to each job that you are applying for.
This is important because many employers use applicant tracking systems these days – computer programs designed to scan resumes and identify certain keywords before passing them on to a human. Therefore it’s essential that your resume contains all relevant keywords related to the position in question.
In addition, you should also elaborate on some of your most impressive skills/qualifications by discussing them further in other sections such as the summary or experience section.
Below is a list of common skills & terms:
- D
- Data Mining
- Data Storytelling
- Data Wrangling
- Excel
- Js
- Machine Learning
- Power BI
- R Programming
- Statistical Analysis
- Tableau
4. Education
Mentioning an education section on your resume will depend largely on how far along you are in your career. If you just graduated and have no prior experience, mention your education below the resume objective. However, if you have significant work experience to showcase, omitting an education section is perfectly acceptable.
If including an education section is necessary for the data visualization analyst role you’re applying for, try to highlight courses or subjects related directly to this type of job such as statistics or computer programming languages like R and Python.
Bachelor of Science in Computer Science
Educational Institution XYZ
Nov 2011
5. Certifications
Certifications demonstrate to potential employers that you have the necessary qualifications and knowledge in a particular field. Having certifications can help set you apart from other applicants, as it shows that you are committed to staying up-to-date with industry standards and trends.
Including any relevant certifications on your resume will give hiring managers an indication of your level of expertise in certain areas, so make sure to list them if they apply to the job for which you’re applying.
Tableau Desktop Specialist
Tableau
May 2017
6. Contact Info
Your name should be the first thing a reader sees when viewing your resume, so ensure its positioning is prominent. Your phone number should be written in the most commonly used format in your country/city/state, and your email address should be professional.
You can also choose to include a link to your LinkedIn profile, personal website, or other online platforms relevant to your industry.
Finally, name your resume file appropriately to help hiring managers; for Savannah Durgan, this would be Savannah-Durgan-resume.pdf or Savannah-Durgan-resume.docx.
7. Cover Letter
A cover letter is an essential part of any job application and should be included alongside your resume. It’s a great opportunity to showcase your personality, explain why you’re the perfect candidate for the role and demonstrate how well you fit into the company culture.
Cover letters are usually made up of 2-4 paragraphs that provide more detail than what is mentioned in a resume. They can also help set you apart from other applicants by providing additional information about who you are as a professional.
Below is an example cover letter:
Dear Bessie,
I am writing in response to your Data Visualization Analyst position. My experience manipulating and visualizing data using Tableau, Excel, and SQL will enable me to contribute immediately to the [company name] team.
As a Data Analyst at [previous company], I was responsible for designing and creating both static and interactive dashboards utilizing Tableau software. I also created custom reports based on client requests using SQL queries. In addition, I performed ad hoc analysis of customer data as needed. My work helped the company save over $1 million annually by identifying errors in our marketing campaigns targeting new customers.
In my current role as a Data Visualization Specialist at [current company], I create executive-level dashboard reporting using Tableau that is distributed weekly to clients. The reports help clients understand their social media analytics data so they can make informed decisions about their digital marketing strategies. Additionally, I train other analysts on best practices for data visualization using various tools like Excel, Google Analytics, and Tableau Public. To date, I have trained 15 people across 3 departments within the company (Marketing, Sales, Customer Service).
The skills that have contributed most to my success are:
– Strong attention to detail with an eye for design; able to create visually appealing displays of information that are easy for non-technical users to understand – Technical proficiency in multiple software programs including Tableau, Excel, PowerPoint, and SQL – Excellent written communication skills; able to clearly explain complex technical concepts in layman’s terms – Ability to work independently as well as collaboratively within a team environment – Proven track record of meeting deadlines while producing high quality work product Enclosed please find my resume which outlines additional details regarding my professional background and achievements
Sincerely,
Savannah
Data Visualization Analyst Resume Templates
 Gharial
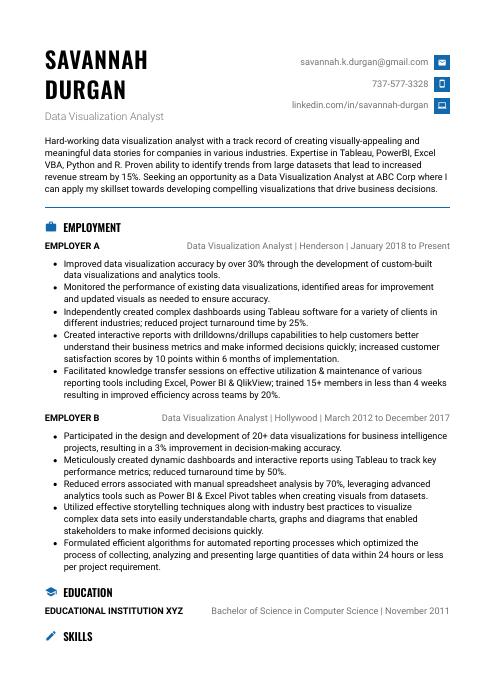 Echidna
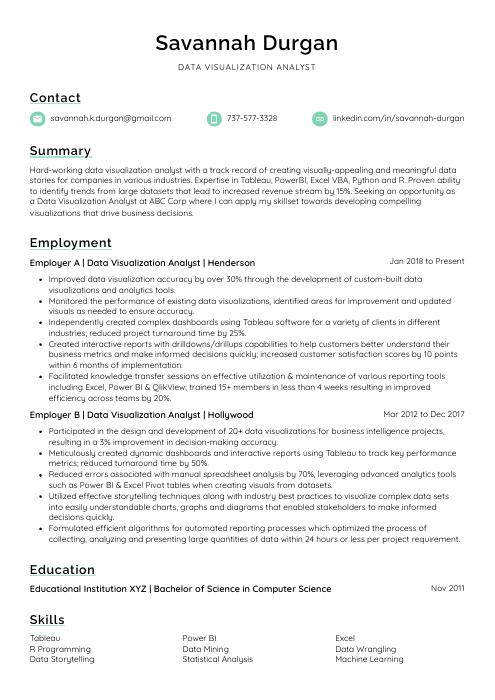 Lorikeet
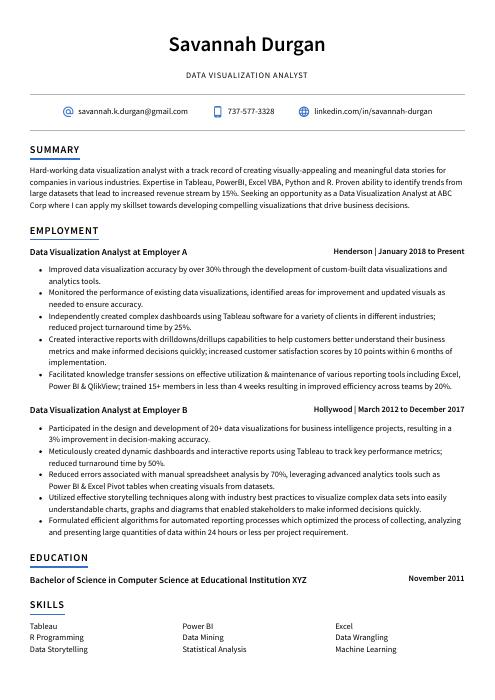 Axolotl
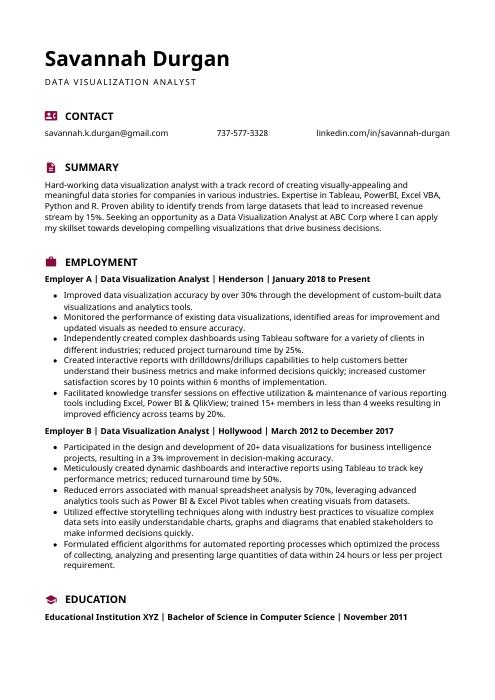 Hoopoe
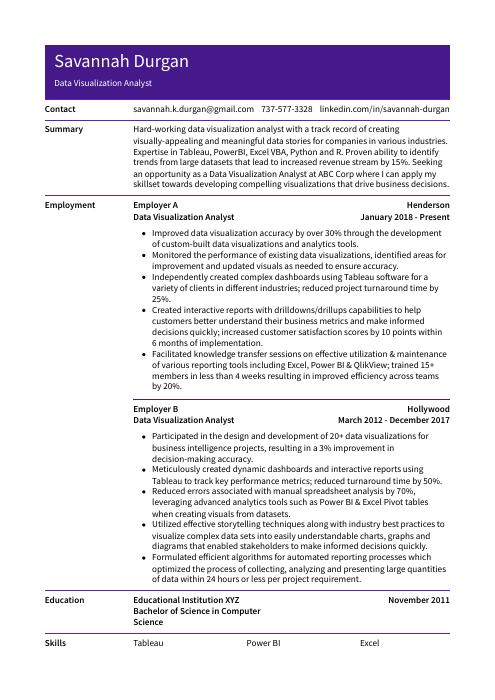 Pika
Pika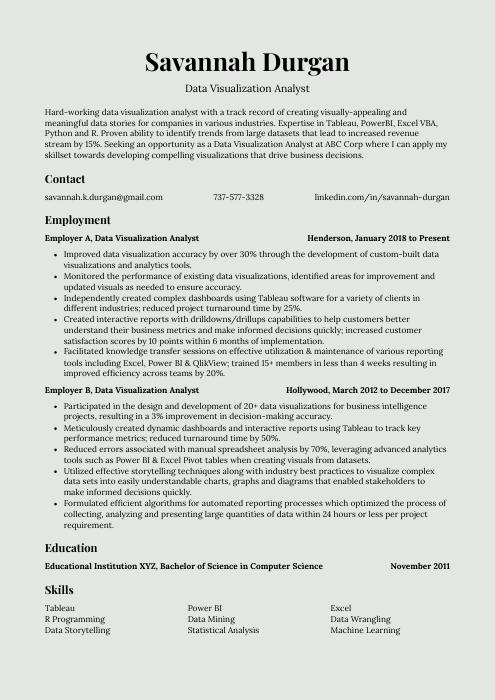 Saola
Saola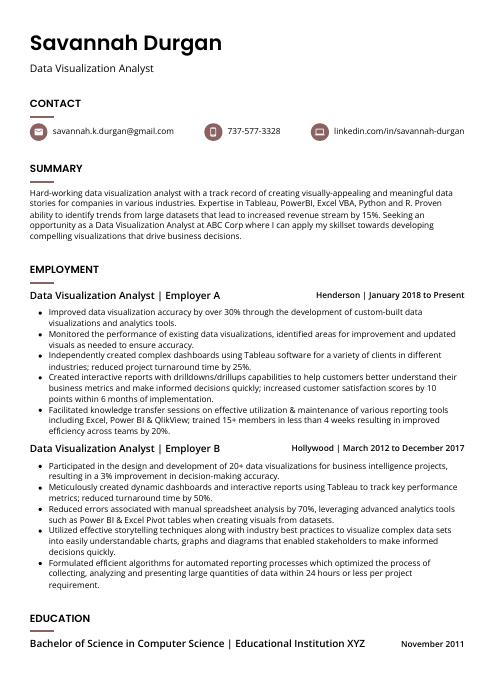 Fossa
Fossa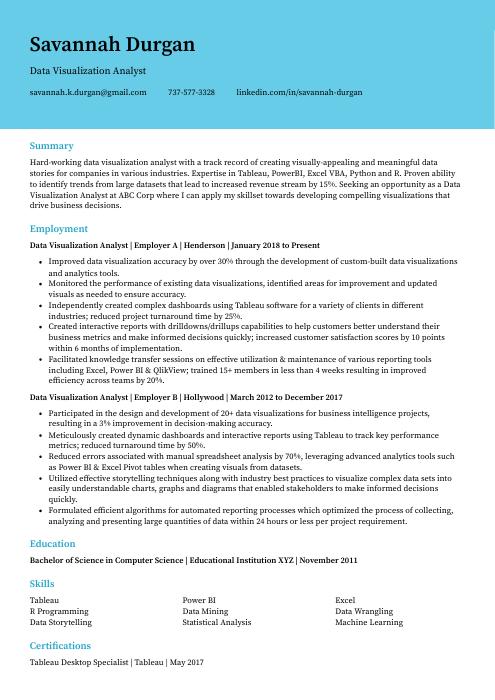 Dugong
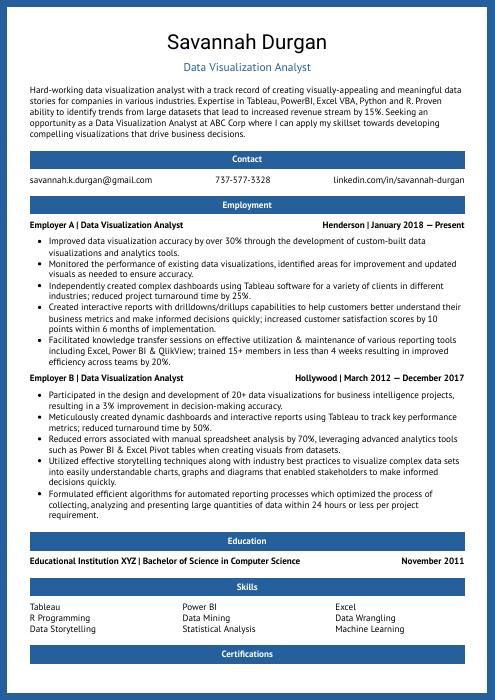 Ocelot
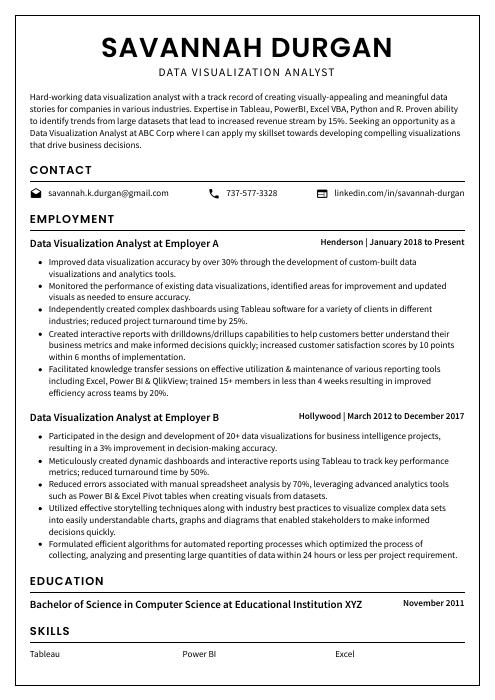 Cormorant
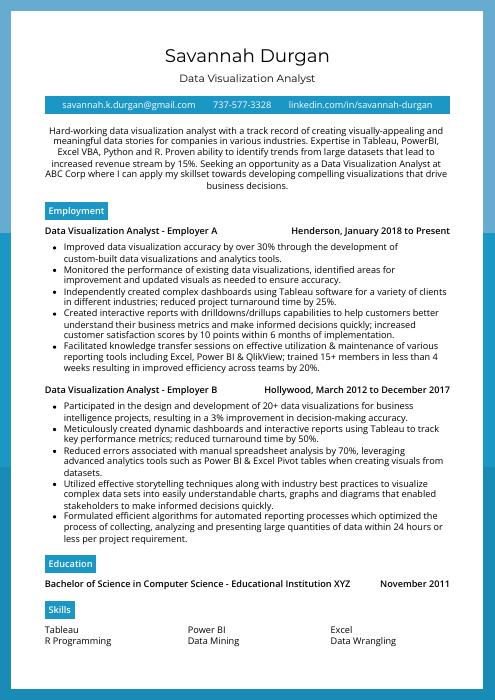 Rhea
Rhea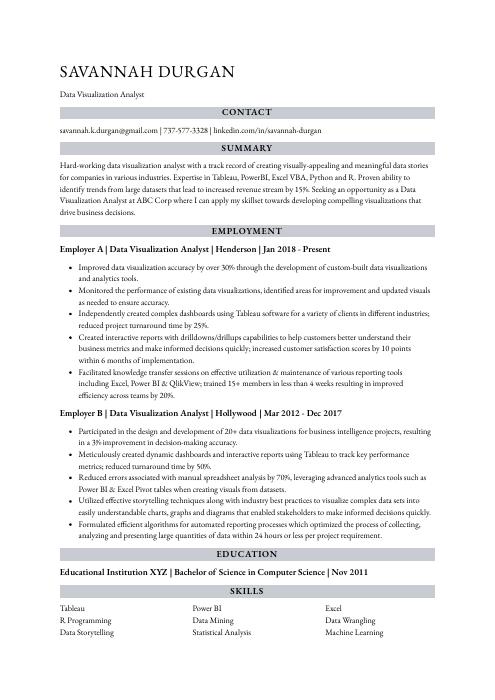 Numbat
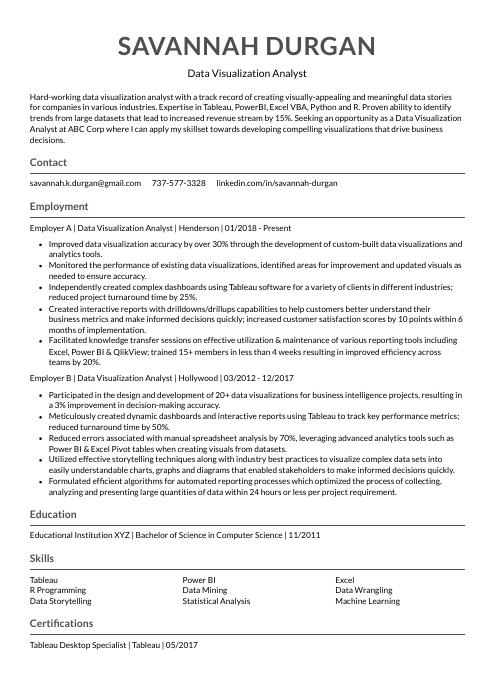 Indri
Indri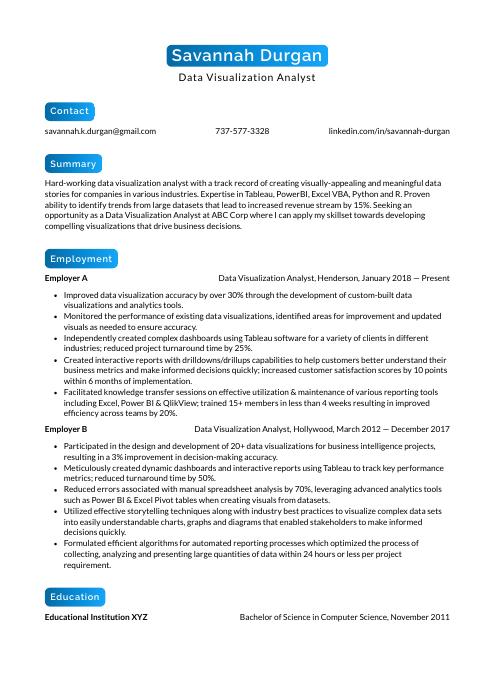 Kinkajou
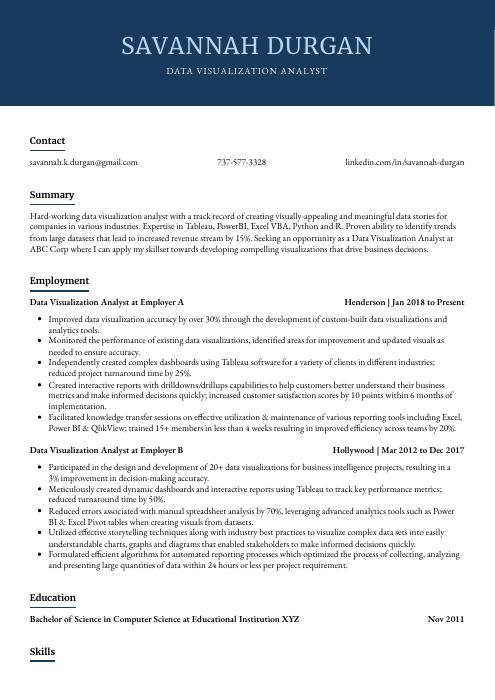 Bonobo
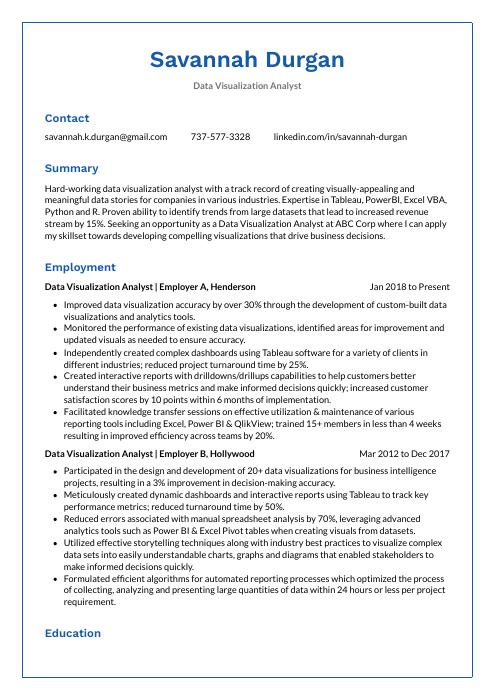 Markhor
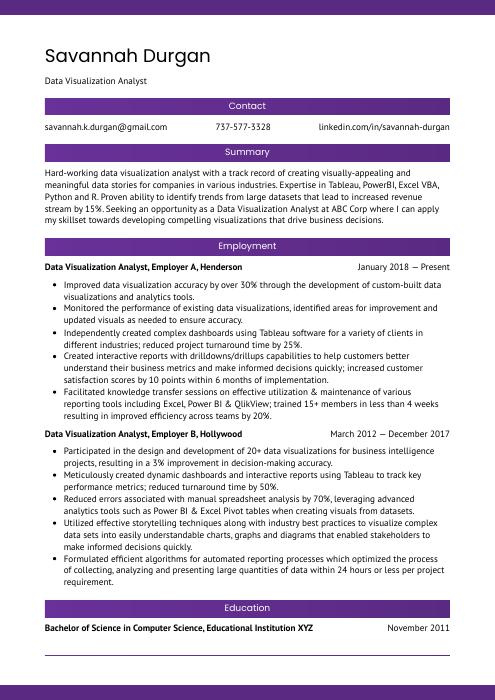 Jerboa
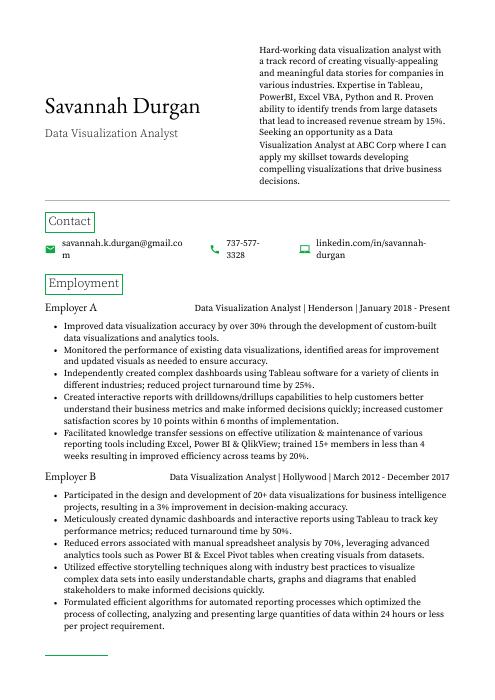 Quokka